Analysis
Currently, the input file for analysis should be in netCDF format. So, first the raw ASCII files should be converted to netCDF using previous steps. We are working to make it accept ASCII files as input.
In the following examples we have used GCNet station at Summit, if you are using a separate network, you need to change the variable name accordingly.
JAWS has the ability to analyze the data in multiple ways such as:
Diurnal
JAWS can be used to plot the monthly diurnal cycle to see hourly changes for any variable throughout the month.
The user needs to provide the input file path, variable name (on which analysis needs to be done) and
analysis type (i.e. diurnal, monthly, annual or seasonal). The argument for analysis is -a, --anl or --analysis and
variable name is -v, --var or --variable.
We will take two examples here:
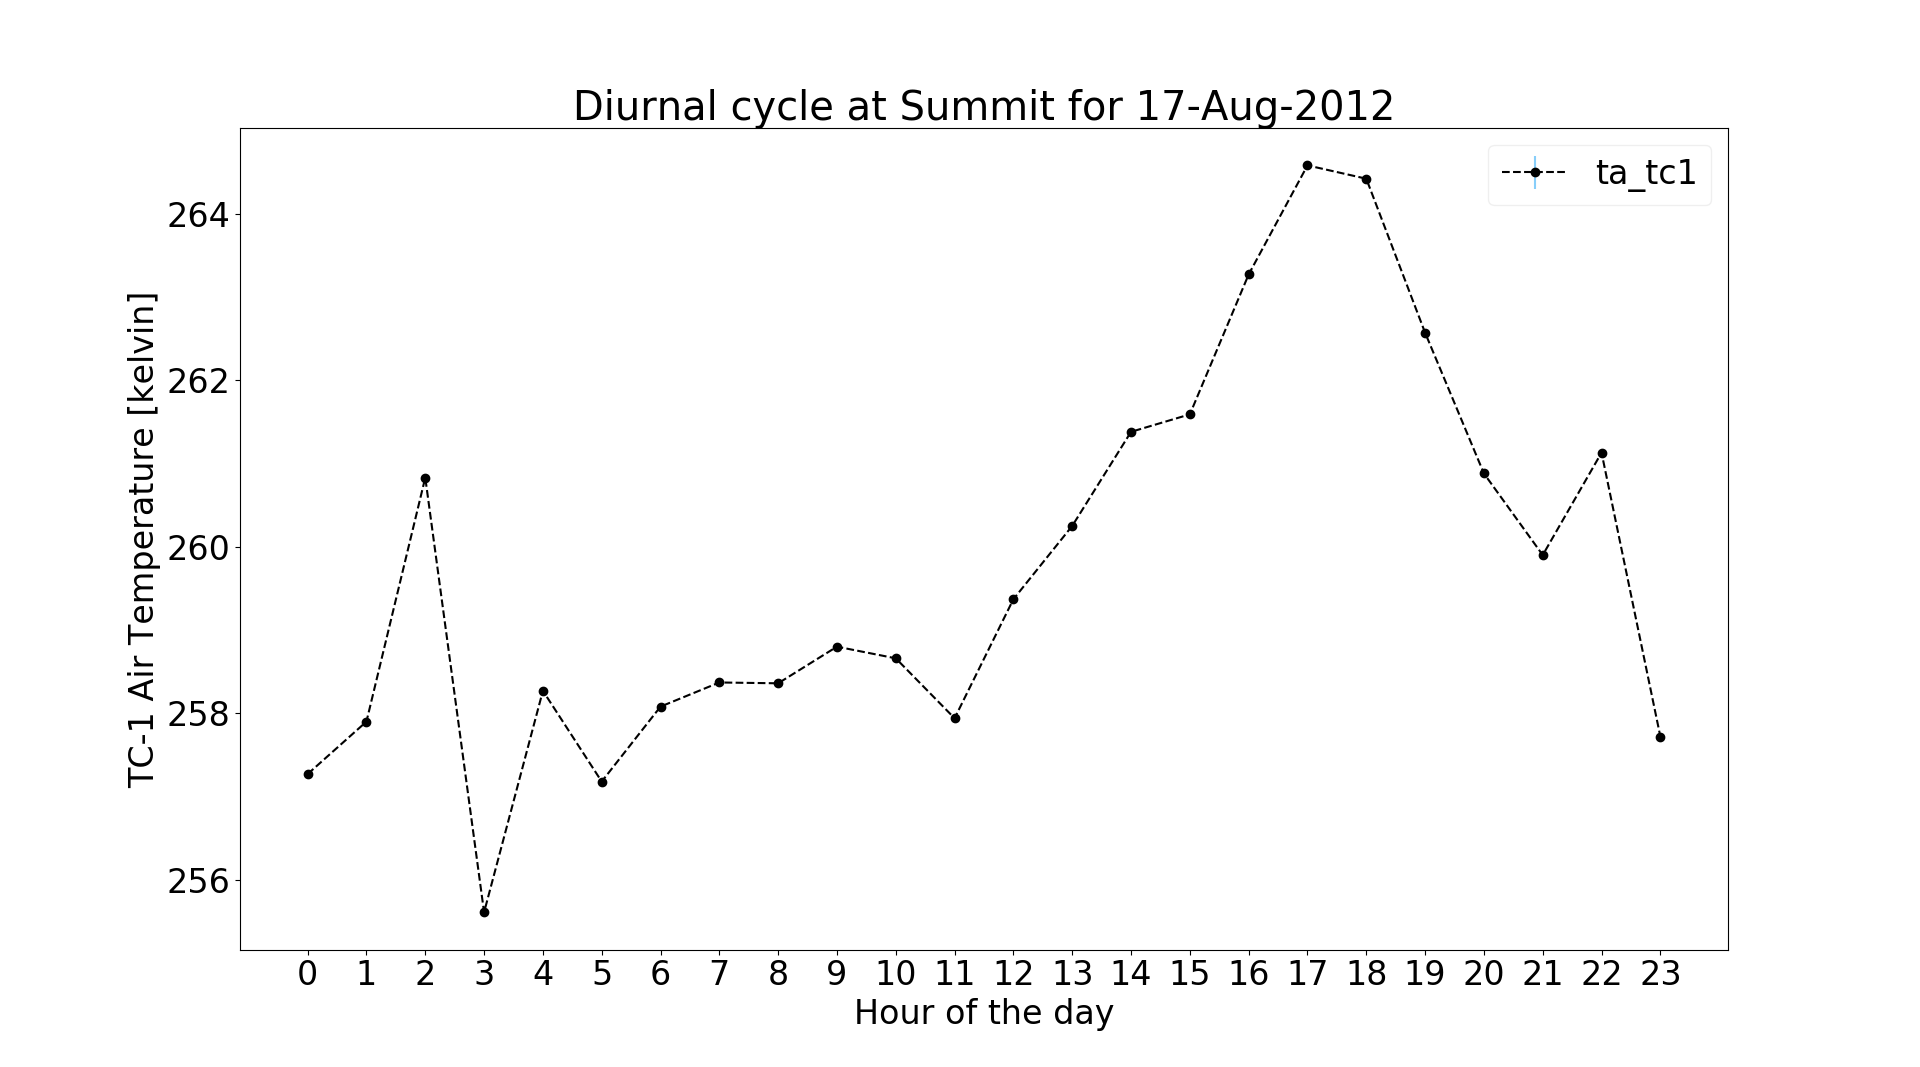
Case 1: The input file contains only 1-day data. We will consider the file converted previously i.e. GCNet_Summit_20120817.nc. By default, the temperature variables will be in Kelvin (K) units in converted netCDF file. If you would like them in Celsius (°C), please use
-c, --cel, --celsius--centigradeoption when converting the raw file to netCDF. Please note that--analysisoption will only use units that are in netCDF file and units can’t be changed during this step.Use the following command to see how temperature varies throughout the day:
$ jaws -a diurnal -v ta_tc1 GCNet_Summit_20120817.nc
Case 2: We will be using multi-year data from GCNet-Summit. We don’t have permission to host this data.
Since, there are many years and months in this file, we need to provide for which year and month we want to do the analysis. The argument for year is
-y, --anl_yr or --analysis_yearand month is-m, --anl_mth or --analysis_month.If the input file contains data for only single year, then the user doesn’t need to provide the ‘-y’ argument. Similar is the case for ‘-m’ (month) argument.
We will do the analysis for May-2002 at GCNet_Summit:
$ jaws -a diurnal -v ta_tc1 -y 2002 -m 5 gcnet_summit.nc
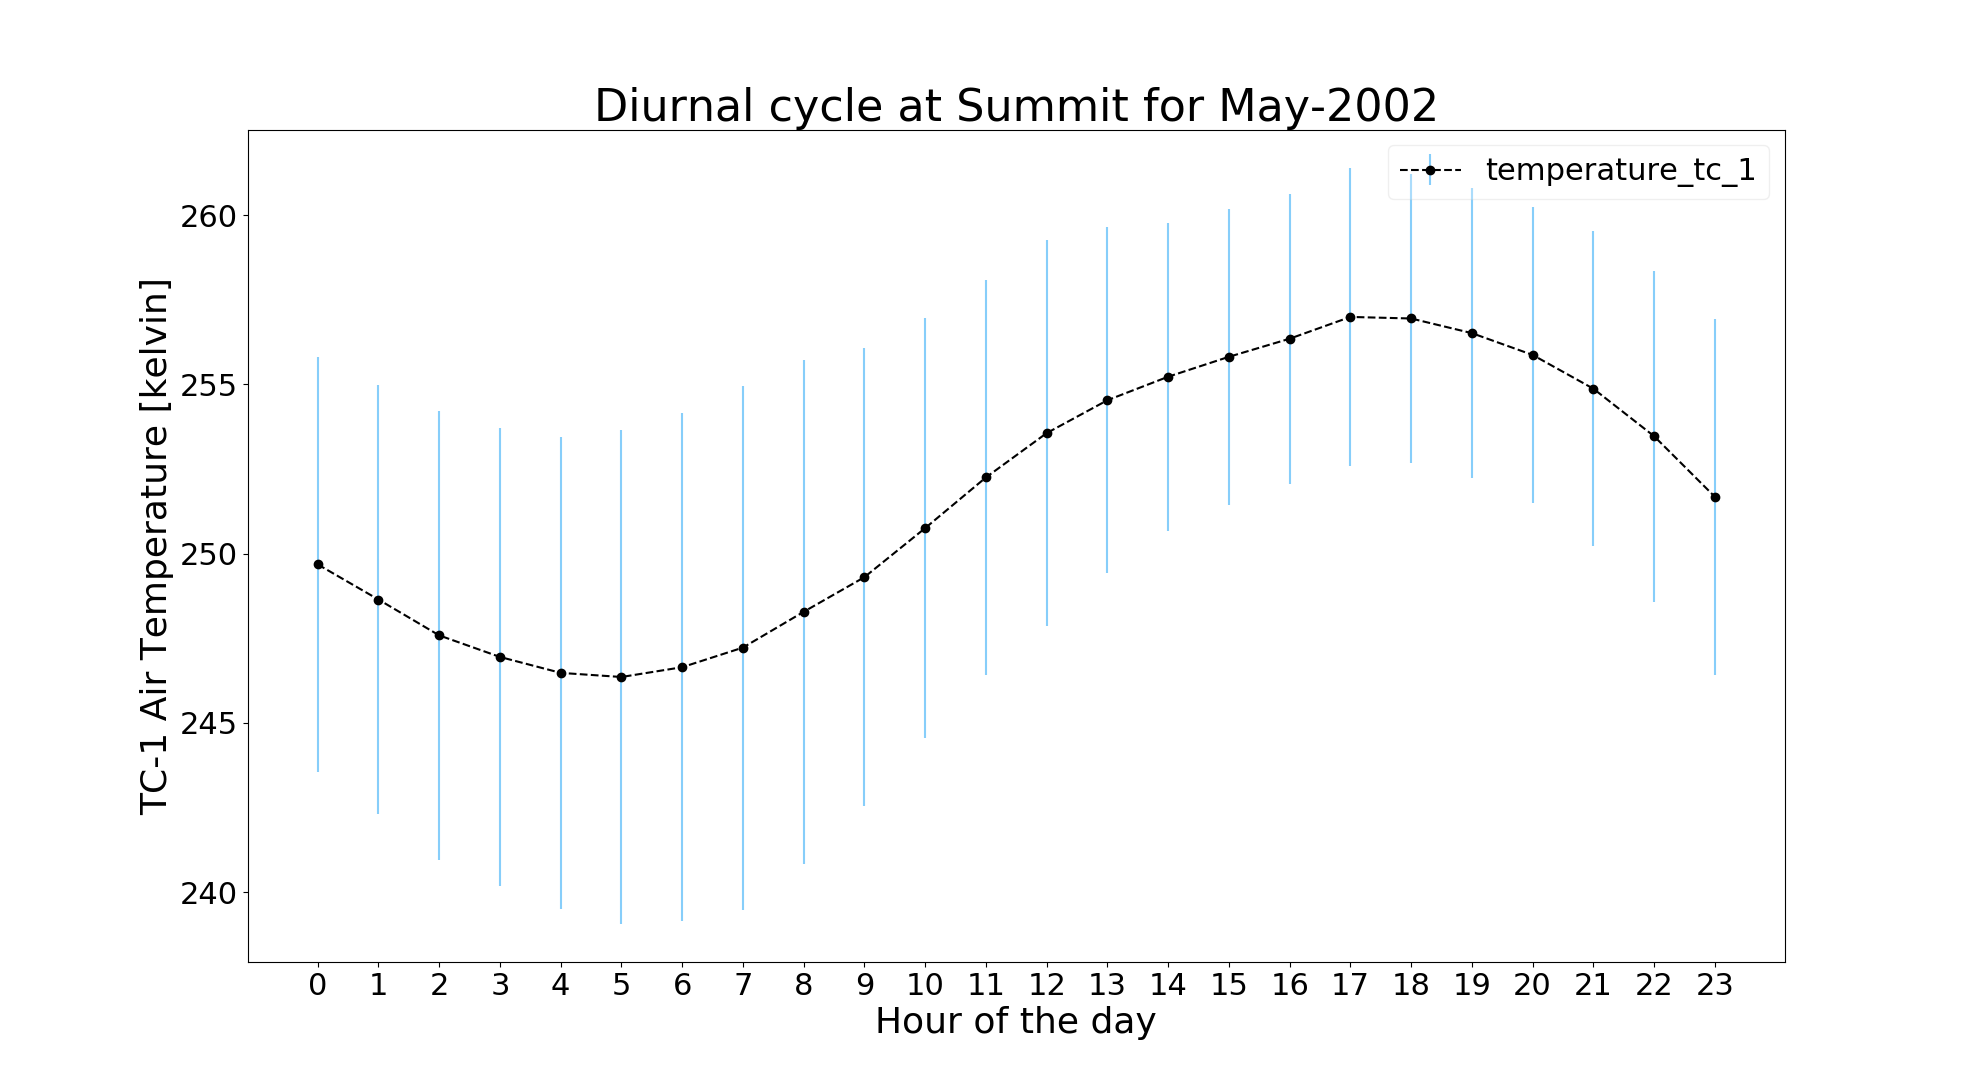
The blue error bar shows standard deviation for that hour across the month.
Important: This same file from Case 2 will be used for the next three analysis because we need at least the monthly, yearly and
multi-yearly data.
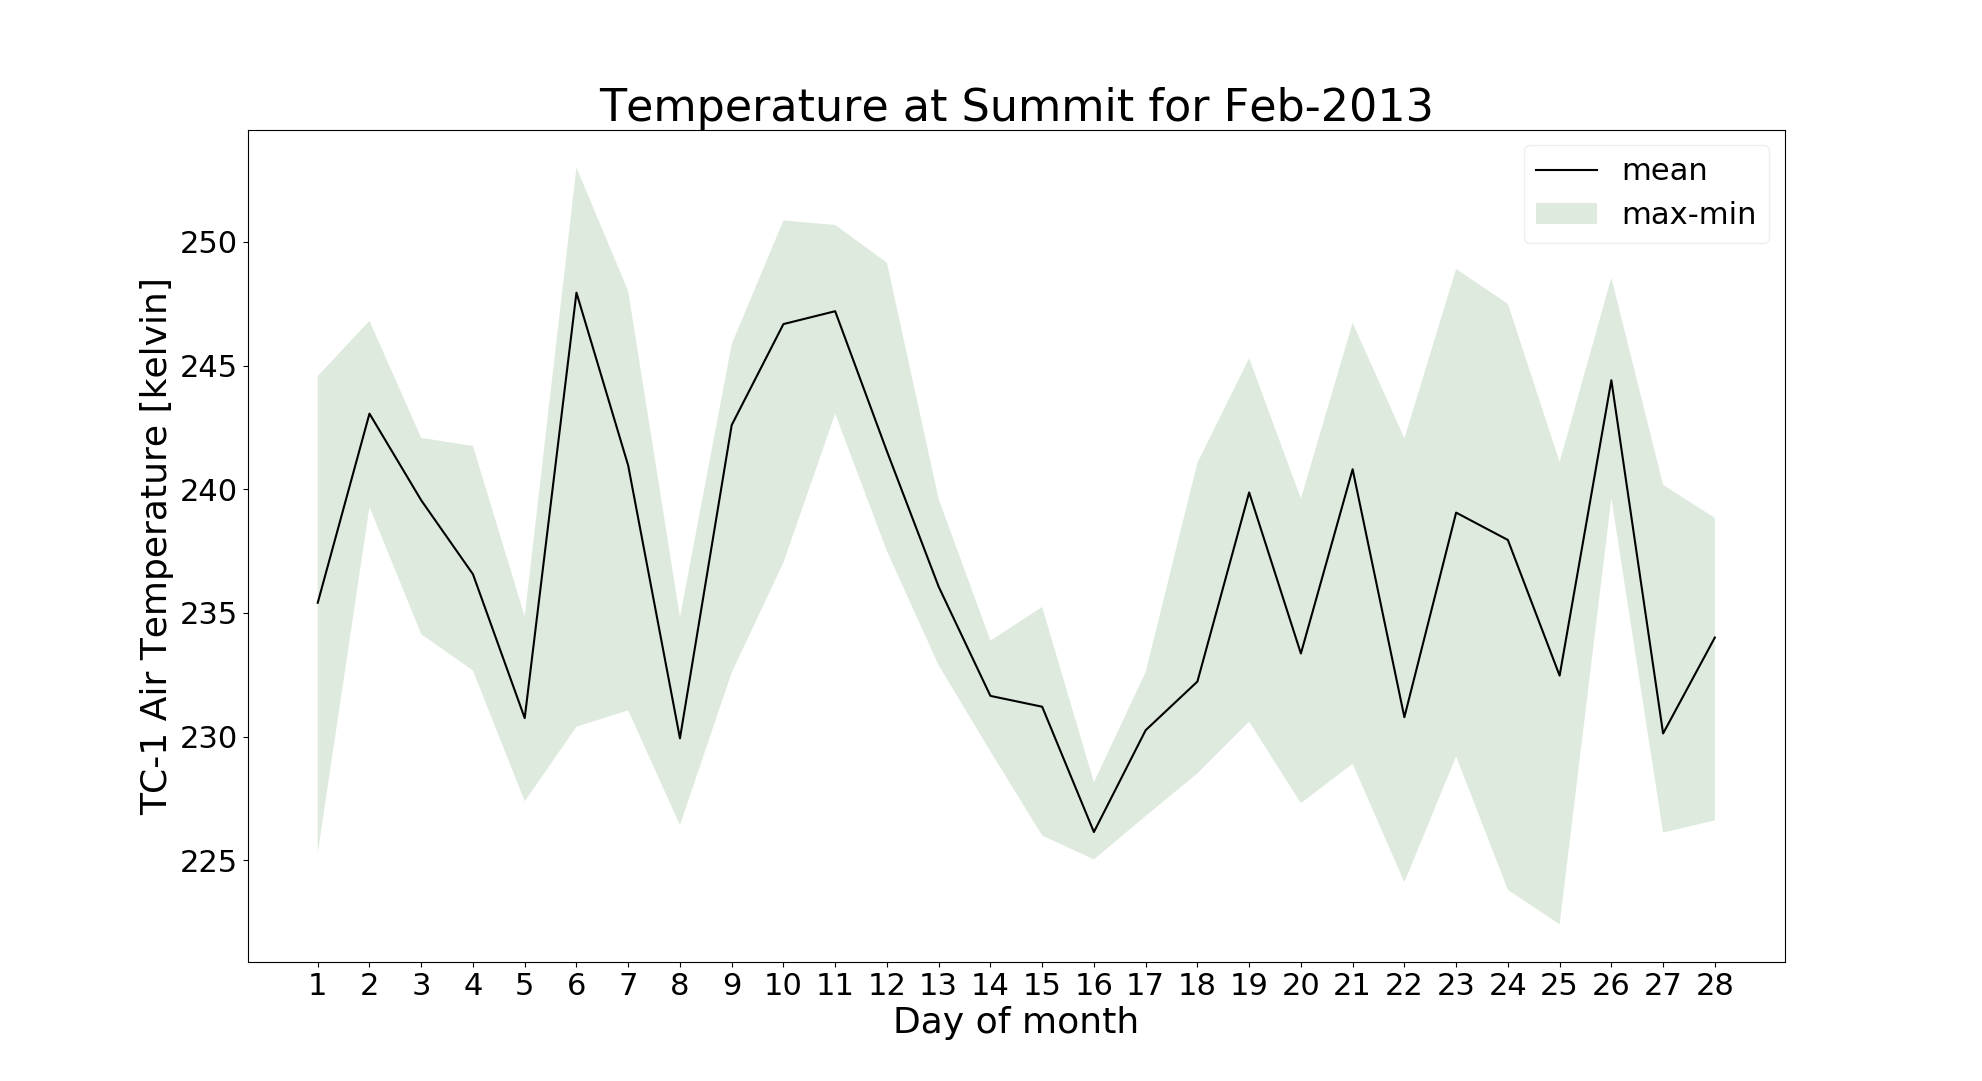
Monthly
In this analysis, we can analyze avg, max and min values for each day of a month for any variable
This time we will do it for temperature from a different sensor for Feb-2013 as following:
$ jaws --anl monthly --var ta_cs1 --anl_yr 2013 --anl_mth 2 gcnet_summit.nc
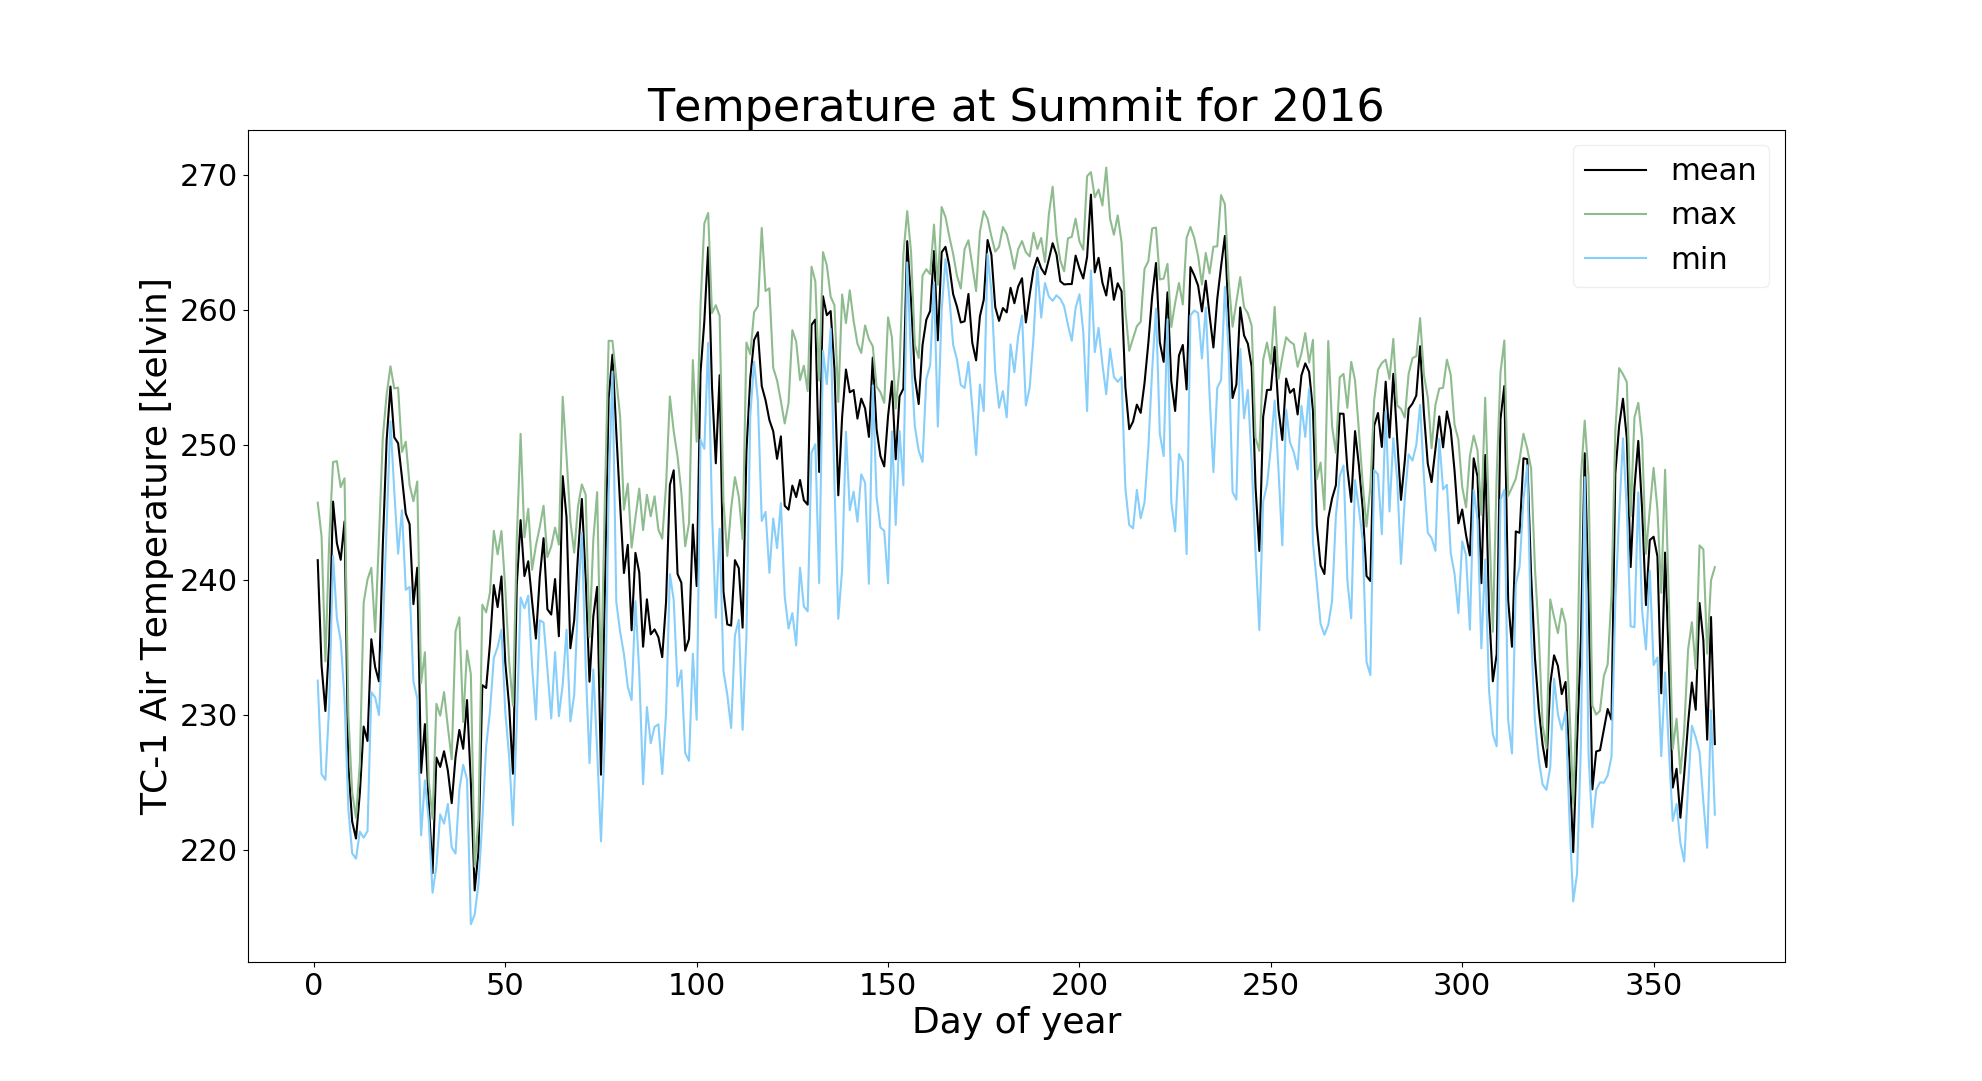
Annual
To plot an annual cycle with daily mean, max and min:
$ jaws --analysis annual --variable ta_tc1 --analysis_year 2016 gcnet_summit.nc
Note: Since this is an annual plot, the user shouldn’t provide the ‘-m’ argument
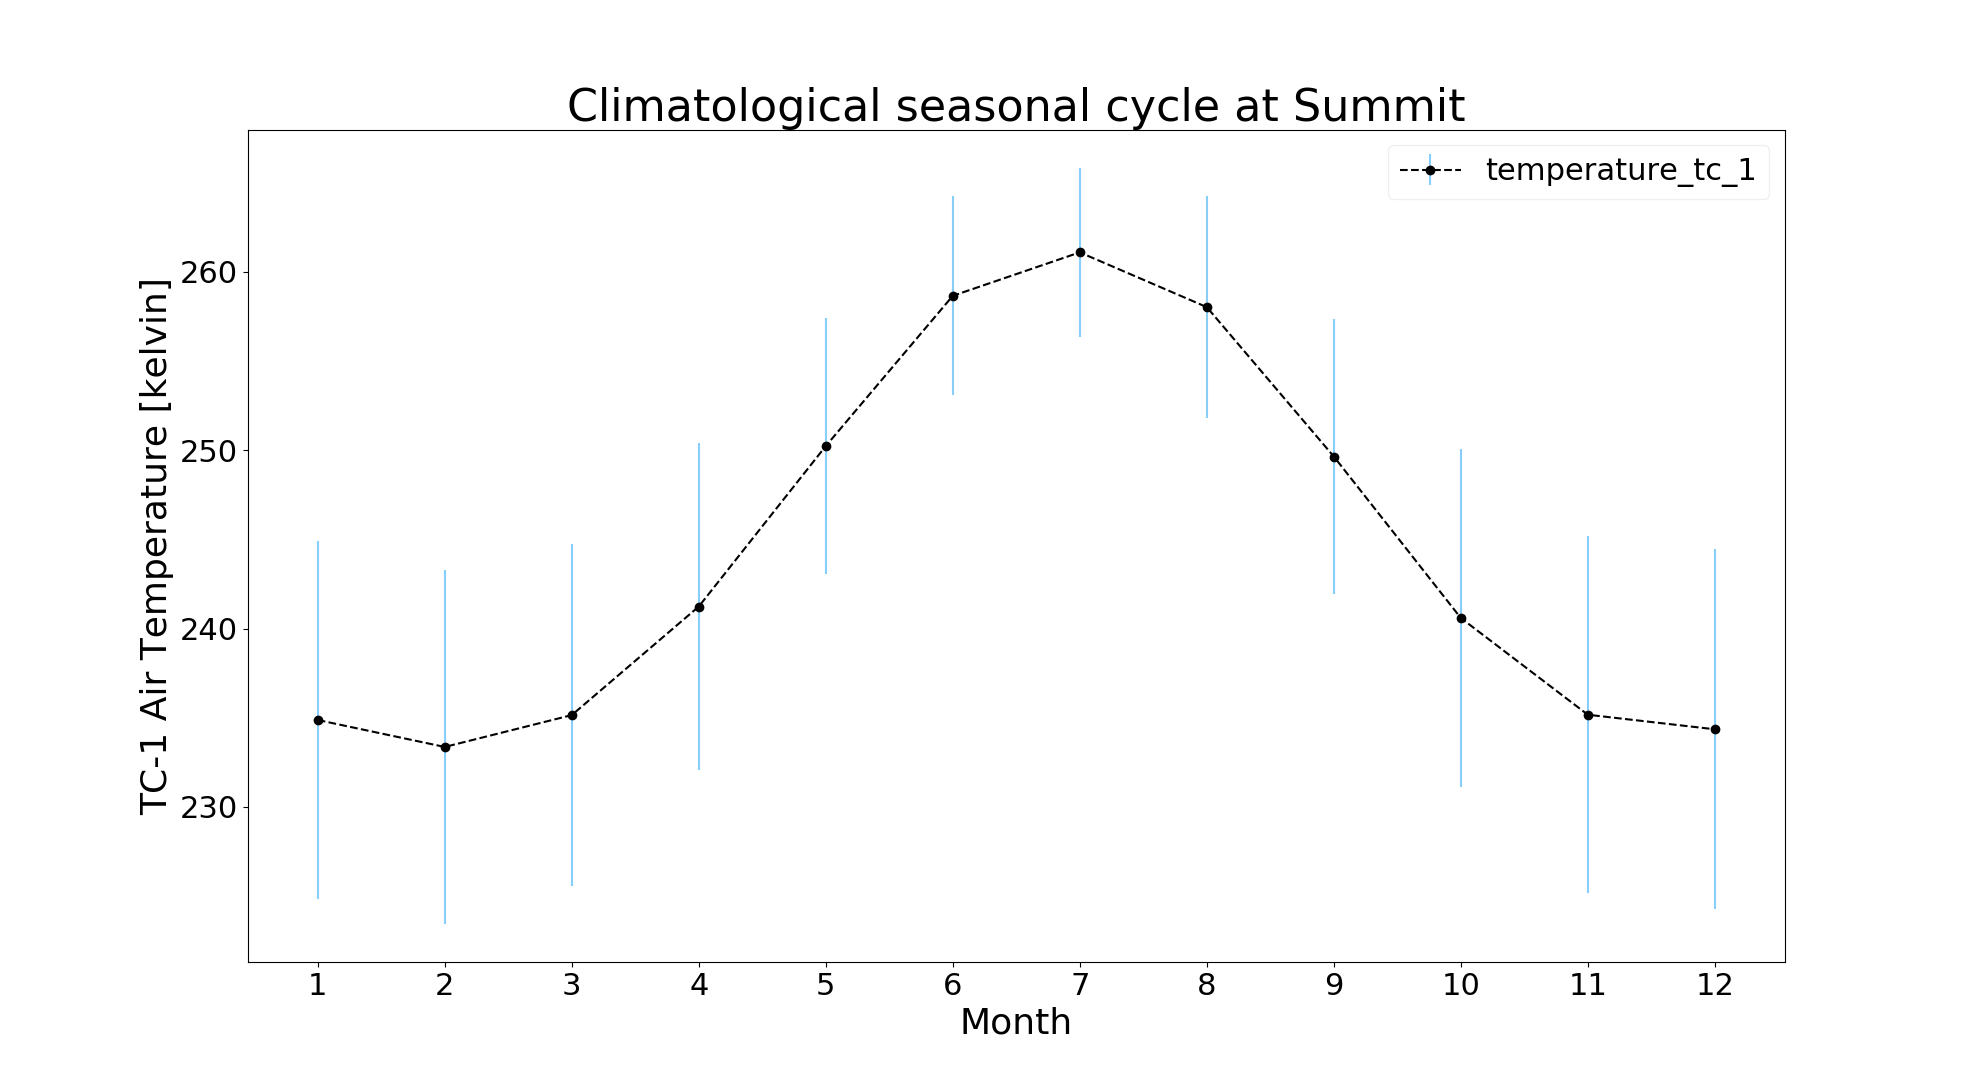
Seasonal
Climatological seasonal cycle showing variation for each month through multiple years:
$ jaws -a seasonal -v ta_tc1 gcnet_summit.nc
Note: Since this is a seasonal plot, the user shouldn’t provide both ‘-y’, ‘-m’ argument.